Using S curve parameter panels
An S curve parameter panel shows a graph with an S-shaped curve on it. These curves are used for only three parameters: overall growth, leaf growth, and fruit growth.
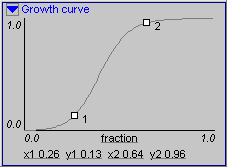
The name labels the parameter. The four values (for x and y values for the two points) are at the bottom of the graph. The x and y bounds are at the start and end of each axis. The two points are shown by squares and labeled 1 and 2.
To change a value in an S curve parameter panel,
▪ Click on one of the two points and drag it around. You cannot drag the points into positions that will make the exponential equation described by the s curve fail. The plant will respond to the change when you release the mouse button.
-or-
▪ Click on one of the two points and press a left or right or up or down arrow key on the keyboard. This will change the X or Y position of the selected point by a small amount.
-or-
▪ Click on one of the four values below the graph (or press Enter when the value is selected), type a new number into the dialog that appears, and click OK.
S curves always have their bounds set at 0-1 for both axes. You should not change these bounds. You cannot change the unit on any S curves in the program.
Created with the Personal Edition of HelpNDoc: Create HTML Help, DOC, PDF and print manuals from 1 single source